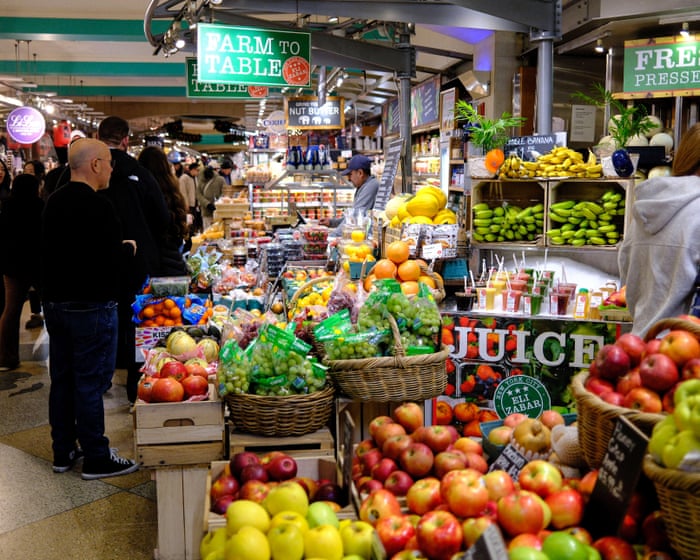
Food prices remain one of the most persistent cost pressures for households worldwide. In 2026, grocery bills are projected to rise sharply in some countries, while remaining relatively stable in others.
According to new forecasts from the UN’s Food and Agriculture Organization (FAO), food inflation will vary dramatically across 160 countries in 2026, ranging from double-digit surges in some economies to outright price declines in others.
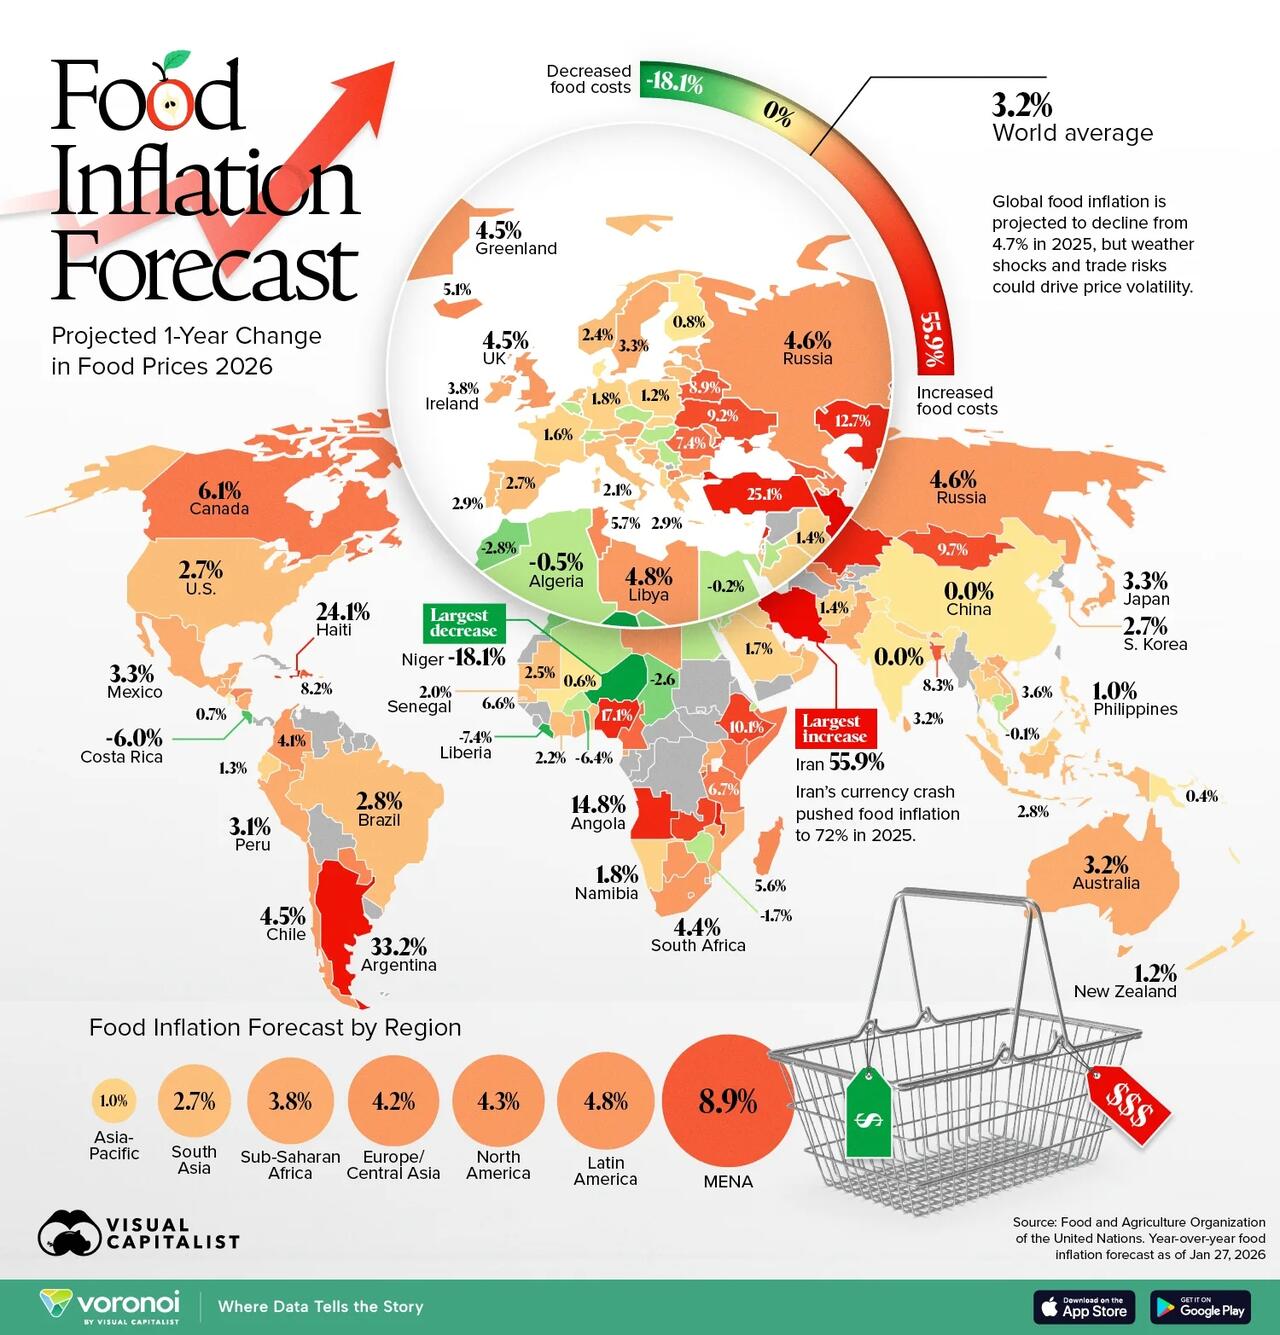
This map, via Visual Capitalist's Dorothy Neufeld, ranks 160 countries by their projected year-over-year change in food prices, highlighting where households are likely to face the steepest increases in 2026.
The Countries Facing the Steepest Food Price Increases
Today, inflation pressures remain strongest in emerging and import-dependent economies.
Food inflation is influenced by currency movements, commodity prices, trade disruptions, and domestic supply conditions. Countries experiencing currency depreciation or ongoing economic instability tend to see sharper increases in food costs.
| Rank | Country | Year-Over-Year Food Inflation Forecast 2026 (%) |
|---|---|---|
| 1 | 🇮🇷 Iran | 55.9 |
| 2 | 🇦🇷 Argentina | 33.2 |
| 3 | 🇹🇷 Türkiye | 25.1 |
| 4 | 🇭🇹 Haiti | 24.1 |
| 5 | 🇲🇼 Malawi | 21.2 |
| 6 | 🇳🇬 Nigeria | 17.1 |
| 7 | 🇱🇧 Lebanon | 14.9 |
| 8 | 🇦🇴 Angola | 14.8 |
| 9 | 🇰🇿 Kazakhstan | 12.7 |
| 10 | 🇿🇲 Zambia | 10.8 |
| 11 | 🇪🇹 Ethiopia | 10.1 |
| 12 | 🇯🇲 Jamaica | 9.7 |
| 13 | 🇲🇳 Mongolia | 9.7 |
| 14 | 🇰🇬 Kyrgyzstan | 9.4 |
| 15 | 🇺🇦 Ukraine | 9.2 |
| 16 | 🇧🇾 Belarus | 8.9 |
| 17 | 🇸🇧 Solomon Islands | 8.8 |
| 18 | 🇧🇮 Burundi | 8.8 |
| 19 | 🇧🇩 Bangladesh | 8.3 |
| 20 | 🇩🇴 Dominican Republic | 8.2 |
| 21 | 🇬🇪 Georgia | 8.2 |
| 22 | 🇷🇴 Romania | 7.4 |
| 23 | 🇨🇻 Cabo Verde | 7.2 |
| 24 | 🇰🇼 Kuwait | 7.2 |
| 25 | 🇨🇲 Cameroon | 7.0 |
| 26 | 🇦🇿 Azerbaijan | 6.8 |
| 27 | 🇰🇪 Kenya | 6.8 |
| 28 | 🇸🇴 Somalia | 6.7 |
| 29 | 🇹🇿 Tanzania | 6.7 |
| 30 | 🇬🇲 Gambia | 6.6 |
| 31 | 🇨🇦 Canada | 6.1 |
| 32 | 🇹🇳 Tunisia | 5.7 |
| 33 | 🇰🇾 Cayman Islands | 5.7 |
| 34 | 🇲🇬 Madagascar | 5.6 |
| 35 | 🇰🇳 Saint Kitts and Nevis | 5.6 |
| 36 | 🇺🇿 Uzbekistan | 5.5 |
| 37 | 🇵🇾 Paraguay | 5.3 |
| 38 | 🇭🇳 Honduras | 5.2 |
| 39 | 🇨🇼 Curaçao | 5.1 |
| 40 | 🇮🇸 Iceland | 5.1 |
| 41 | 🇲🇰 North Macedonia | 5.0 |
| 42 | 🇷🇼 Rwanda | 4.9 |
| 43 | 🇲🇩 Moldova | 4.9 |
| 44 | 🇧🇼 Botswana | 4.8 |
| 45 | 🇱🇾 Libya | 4.8 |
| 46 | 🇱🇸 Lesotho | 4.7 |
| 47 | 🇦🇬 Antigua and Barbuda | 4.7 |
| 48 | 🇷🇺 Russia | 4.6 |
| 49 | 🇬🇱 Greenland | 4.5 |
| 50 | 🇨🇱 Chile | 4.5 |
| 51 | 🇿🇦 South Africa | 4.4 |
| 52 | 🇸🇮 Slovenia | 4.3 |
| 53 | 🇧🇹 Bhutan | 4.3 |
| 54 | 🇶🇦 Qatar | 4.2 |
| 55 | 🇬🇧 UK | 4.5 |
| 56 | 🇨🇴 Colombia | 4.1 |
| 57 | 🇲🇹 Malta | 4.0 |
| 58 | 🇹🇯 Tajikistan | 3.8 |
| 59 | 🇱🇻 Latvia | 3.8 |
| 60 | 🇮🇪 Ireland | 3.8 |
| 61 | 🇺🇬 Uganda | 3.7 |
| 62 | 🇦🇪 UAE | 3.6 |
| 63 | 🇻🇳 Viet Nam | 3.6 |
| 64 | 🇬🇭 Ghana | 3.6 |
| 65 | 🇵🇰 Pakistan | 3.5 |
| 66 | 🇧🇿 Belize | 3.5 |
| 67 | 🇪🇪 Estonia | 3.5 |
| 68 | 🇧🇬 Bulgaria | 3.4 |
| 69 | 🇦🇹 Austria | 3.4 |
| 70 | 🇧🇦 Bosnia and Herzegovina | 3.4 |
| 71 | 🇲🇽 Mexico | 3.3 |
| 72 | 🇬🇶 Equatorial Guinea | 3.3 |
| 73 | 🇯🇵 Japan | 3.3 |
| 74 | 🇬🇹 Guatemala | 3.3 |
| 75 | 🇸🇪 Sweden | 3.3 |
| 76 | 🇱🇰 Sri Lanka | 3.2 |
| 77 | 🇦🇺 Australia | 3.2 |
| 78 | 🇵🇪 Peru | 3.1 |
| 79 | 🇦🇲 Armenia | 3.1 |
| 80 | 🇲🇿 Mozambique | 3.1 |
| 81 | 🇳🇮 Nicaragua | 3.1 |
| 82 | 🇳🇱 Netherlands | 2.9 |
| 83 | 🇬🇷 Greece | 2.9 |
| 84 | 🇵🇹 Portugal | 2.9 |
| 85 | 🇧🇷 Brazil | 2.8 |
| 86 | 🇮🇩 Indonesia | 2.8 |
| 87 | 🇪🇸 Spain | 2.7 |
| 88 | 🇰🇷 South Korea | 2.7 |
| 89 | 🇱🇺 Luxembourg | 2.7 |
| 90 | 🇺🇸 U.S. | 2.7 |
| 91 | 🇱🇦 Laos | 2.6 |
| 92 | 🇮🇱 Israel | 2.6 |
| 93 | 🇲🇷 Mauritania | 2.5 |
| 94 | 🇳🇴 Norway | 2.4 |
| 95 | 🇲🇪 Montenegro | 2.4 |
| 96 | 🇧🇯 Benin | 2.4 |
| 97 | 🇬🇩 Grenada | 2.3 |
| 98 | 🇨🇮 Côte d'Ivoire | 2.2 |
| 99 | 🇦🇩 Andorra | 2.2 |
| 100 | 🇦🇼 Aruba | 2.1 |
| 101 | 🇮🇹 Italy | 2.1 |
| 102 | 🇸🇳 Senegal | 2.0 |
| 103 | 🇱🇹 Lithuania | 2.0 |
| 104 | 🇴🇲 Oman | 2.0 |
| 105 | 🇧🇧 Barbados | 2.0 |
| 106 | 🇲🇻 Maldives | 1.9 |
| 107 | 🇳🇦 Namibia | 1.8 |
| 108 | 🇩🇪 Germany | 1.8 |
| 109 | 🇲🇾 Malaysia | 1.7 |
| 110 | 🇸🇦 Saudi Arabia | 1.7 |
| 111 | 🇭🇷 Croatia | 1.6 |
| 112 | 🇫🇷 France | 1.6 |
| 113 | 🇸🇰 Slovakia | 1.6 |
| 114 | 🇹🇭 Thailand | 1.5 |
| 115 | 🇮🇶 Iraq | 1.4 |
| 116 | 🇦🇫 Afghanistan | 1.4 |
| 117 | 🇪🇨 Ecuador | 1.3 |
| 118 | 🇦🇱 Albania | 1.2 |
| 119 | 🇳🇵 Nepal | 1.2 |
| 120 | 🇳🇿 New Zealand | 1.2 |
| 121 | 🇵🇱 Poland | 1.2 |
| 122 | 🇵🇫 French Polynesia | 1.1 |
| 123 | 🇵🇭 Philippines | 1.0 |
| 124 | 🇲🇺 Mauritius | 0.9 |
| 125 | 🇹🇹 Trinidad and Tobago | 0.9 |
| 126 | 🇻🇨 Saint Vincent and the Grenadines | 0.8 |
| 127 | 🇸🇬 Singapore | 0.8 |
| 128 | 🇫🇮 Finland | 0.8 |
| 129 | 🇩🇰 Denmark | 0.7 |
| 130 | 🇸🇻 El Salvador | 0.7 |
| 131 | 🇲🇱 Mali | 0.6 |
| 132 | 🇧🇭 Bahrain | 0.5 |
| 133 | 🇵🇬 Papua New Guinea | 0.4 |
| 134 | 🇨🇾 Cyprus | 0.4 |
| 135 | 🇧🇳 Brunei Darussalam | 0.4 |
| 136 | 🇩🇲 Dominica | 0.4 |
| 137 | 🇳🇨 New Caledonia | 0.1 |
| 138 | 🇮🇳 India | 0.0 |
| 139 | 🇨🇳 China | 0.0 |
| 140 | 🇰🇭 Cambodia | -0.1 |
| 141 | 🇧🇪 Belgium | -0.1 |
| 142 | 🇪🇬 Egypt | -0.2 |
| 143 | 🇼🇸 Samoa | -0.5 |
| 144 | 🇩🇿 Algeria | -0.5 |
| 145 | 🇩🇯 Djibouti | -0.6 |
| 146 | 🇧🇫 Burkina Faso | -0.8 |
| 147 | 🇸🇨 Seychelles | -1.3 |
| 148 | 🇨🇭 Switzerland | -1.3 |
| 149 | 🇨🇿 Czechia | -1.4 |
| 150 | 🇷🇸 Serbia | -1.5 |
| 151 | 🇯🇴 Jordan | -1.7 |
| 152 | 🇿🇼 Zimbabwe | -1.7 |
| 153 | 🇭🇺 Hungary | -2.2 |
| 154 | 🇹🇩 Chad | -2.6 |
| 155 | 🇲🇦 Morocco | -2.8 |
| 156 | 🇫🇯 Fiji | -3.5 |
| 157 | 🇨🇷 Costa Rica | -6.0 |
| 158 | 🇹🇬 Togo | -6.4 |
| 159 | 🇱🇷 Liberia | -7.4 |
| 160 | 🇳🇪 Niger | -18.1 |
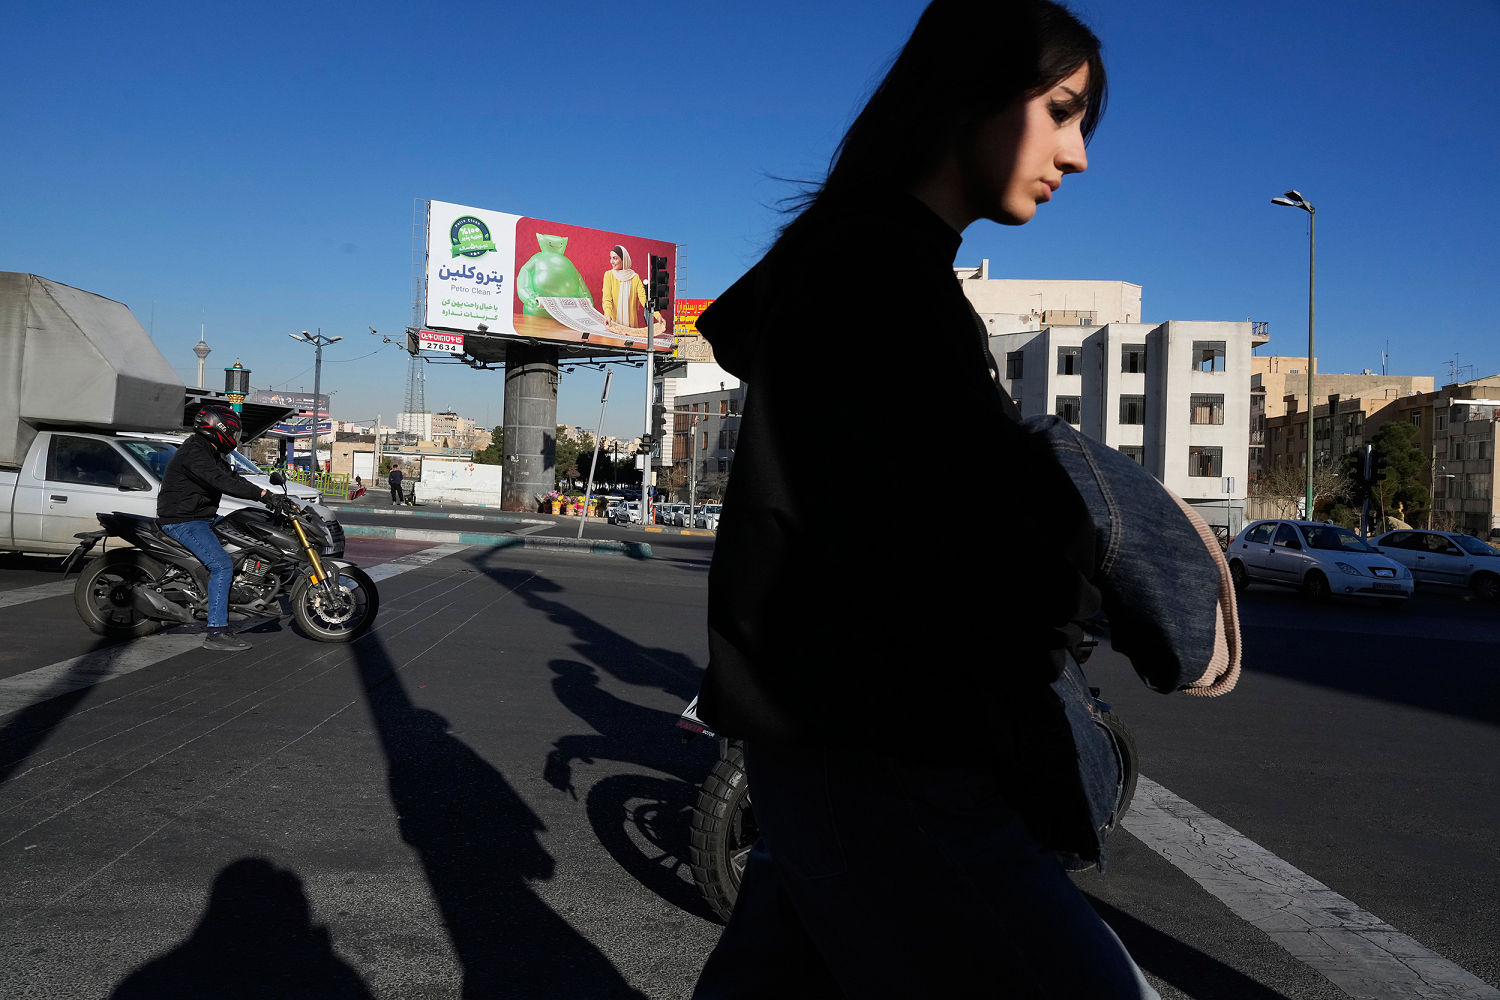
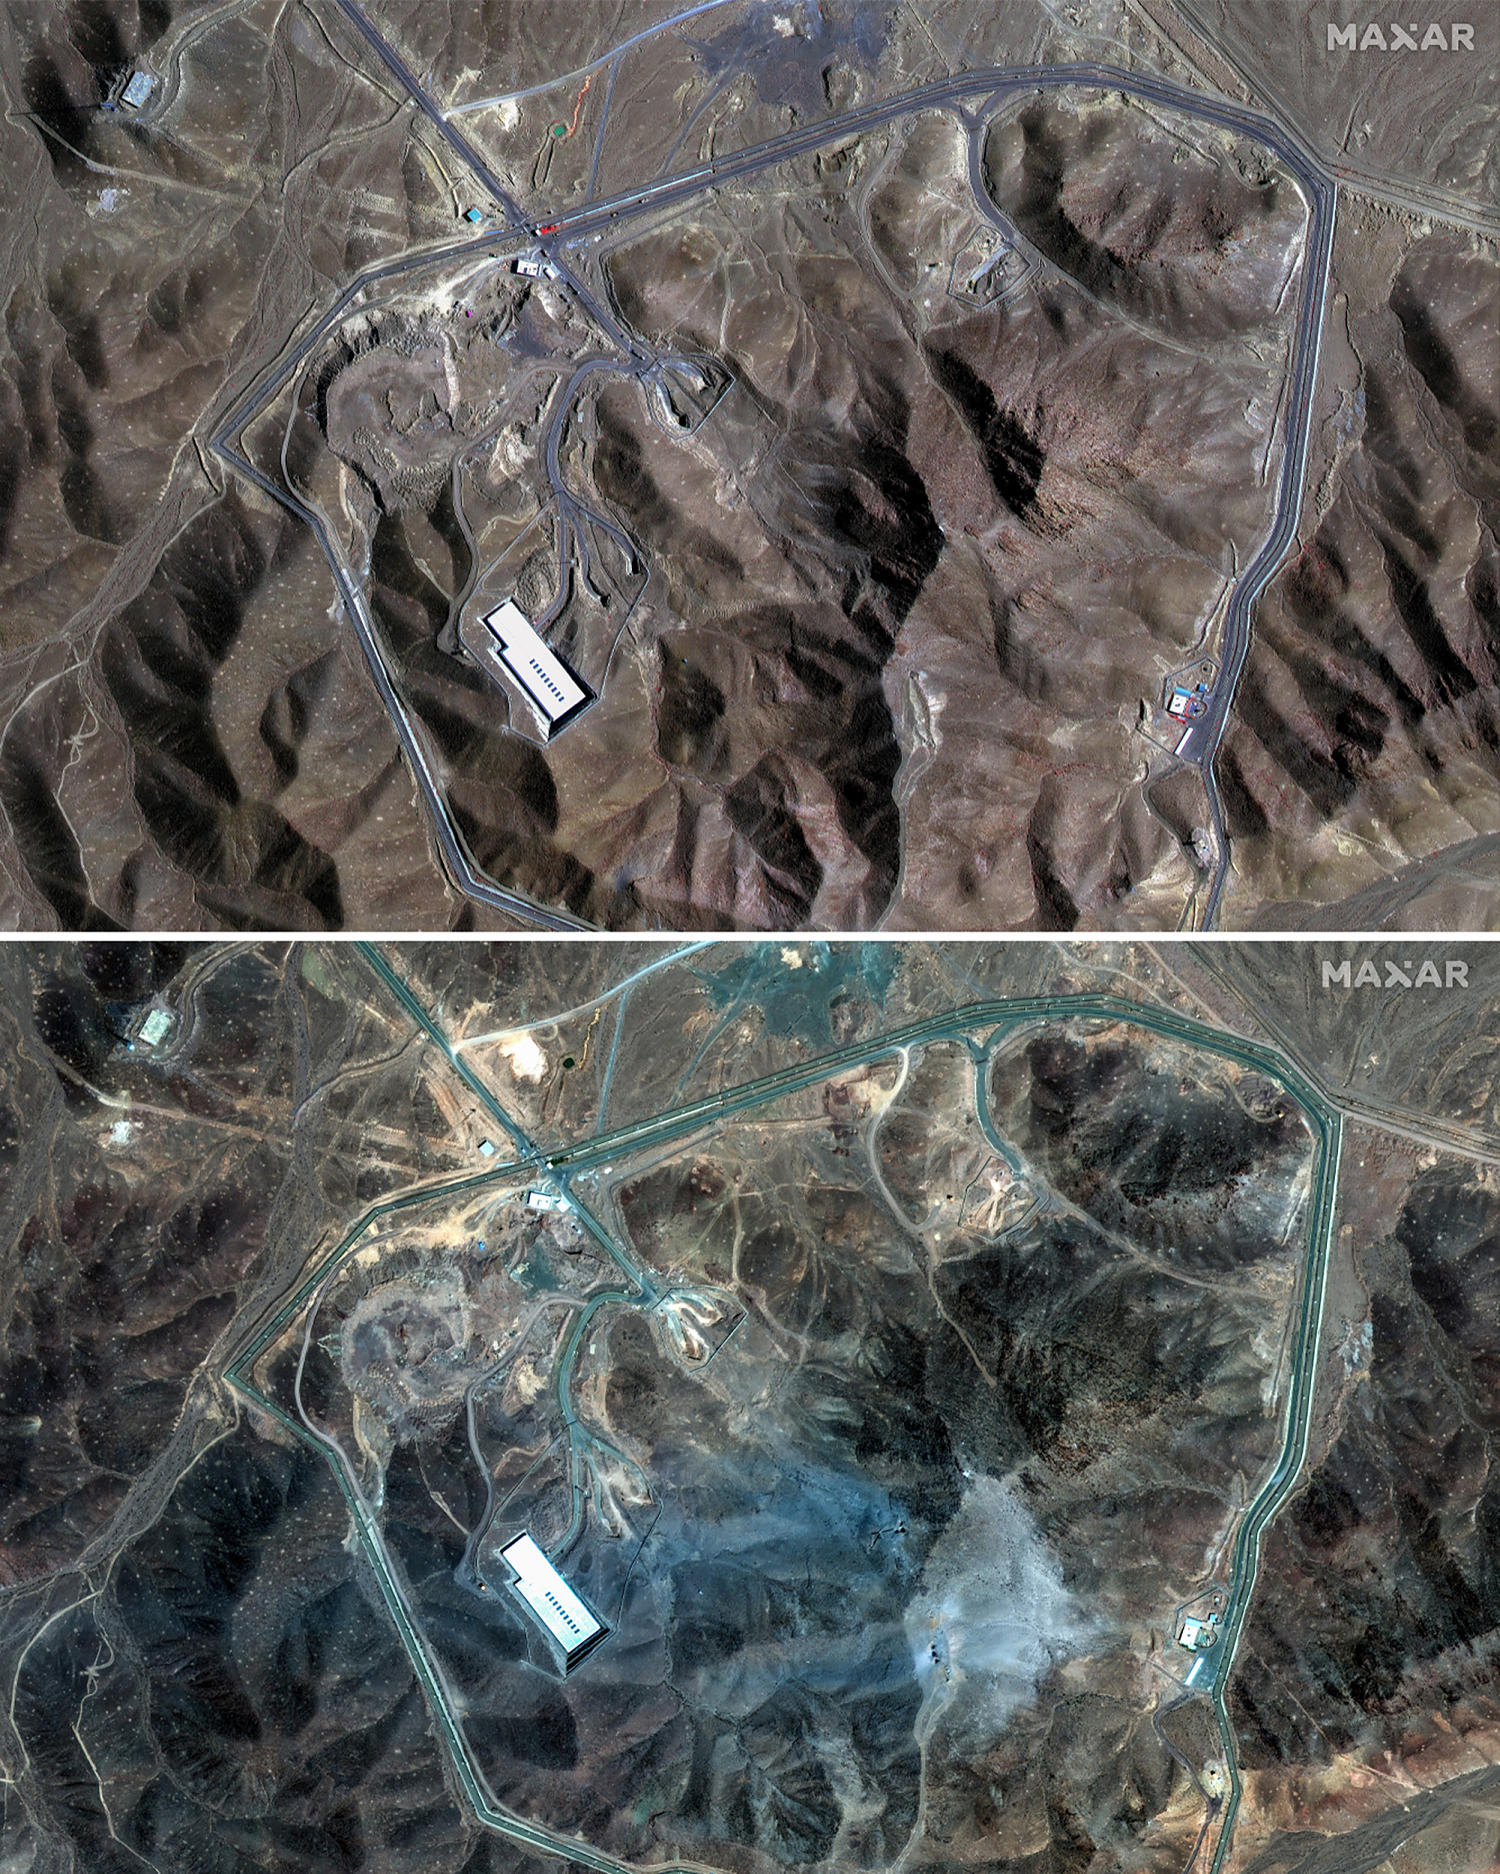
At the top of the ranking is Iran, where food prices are forecast to rise 55.9% year-over-year.
Iran’s currency depreciation and prolonged inflationary pressures have already pushed food inflation to extreme levels in recent years. The 2026 forecast suggests those pressures may persist.
Several Sub-Saharan African economies—including Nigeria (17.1%), Angola (14.8%), Zambia (10.8%), and Ethiopia (10.1%)—also rank among the highest. In many of these countries, food inflation is closely tied to currency volatility, import dependency, and supply-side disruptions.
Regional Differences in Food Inflation
While the global average is projected at 3.2%, the regional breakdown shows stark differences in how food prices are expected to evolve in 2026.
| Region | Year-Over-Year Food Inflation Forecast 2026 (%) |
|---|---|
| Middle East & North Africa (MENA) | 8.9 |
| Latin America | 4.8 |
| North America | 4.3 |
| Europe & Central Asia | 4.2 |
| Sub-Saharan Africa | 3.8 |
| South Asia | 2.7 |
| Asia-Pacific | 1.0 |
The Middle East and North Africa region stands out, with nearly triple the global average.
North America sits around the middle of the pack, with food prices projected to rise 4.3%. In the U.S., prices are expected to increase 2.7%, while in Canada, prices could climb at more than twice that pace.
Meanwhile, much of Asia-Pacific is projected to see relatively modest food price growth.
While global food inflation is expected to fall in the single digits in 2026, the regional picture tells a far more uneven story. For millions of households in high-inflation economies, grocery bills may remain one of the most persistent economic pressures in the year ahead.
To learn more about this topic, check out this graphic on the U.S. cities with the highest grocery costs.


